All the relevant information about at-risk sites in a single app for phone/tablet
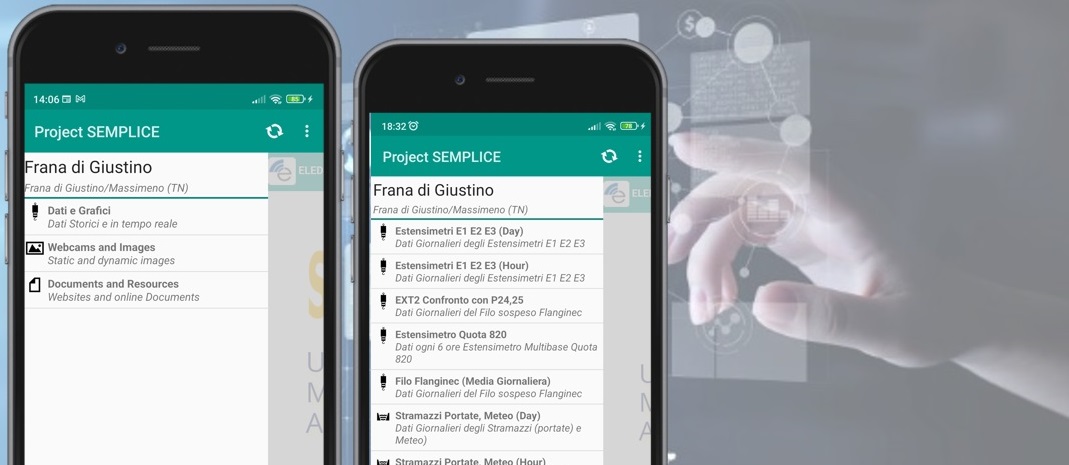
Hierarchical organization of sites and resources for immediate access to information
Transparent synchronization and smart caching of data. Optimized download to reduce consumption
Simplified setup of documents, images, web pages, scientific data, and aggregated information
Any parameters
HW and SW
Collect and interpret heterogeneous data to gain valuable insights and make informed decisions
SEMPLICE organizes the data in a way that makes it easily accessible through an intuitive app. The app serves as a collector of information from various technologies, including weather stations, seismographs, displacement-sensors, and webcams
for any user
for experts
The APP supports a wide range of document formats, including web pages, reports, images, and videos. Additionally, it incorporates advanced charting capabilities for professional and scientific analysis
Real-time charts of big data on your smartphone provide instant insights and analysis
Easy navigation, search, pan, and zoom functionalities
Scatter plots, bar charts, pie charts, and more enable versatile visual representations of the data
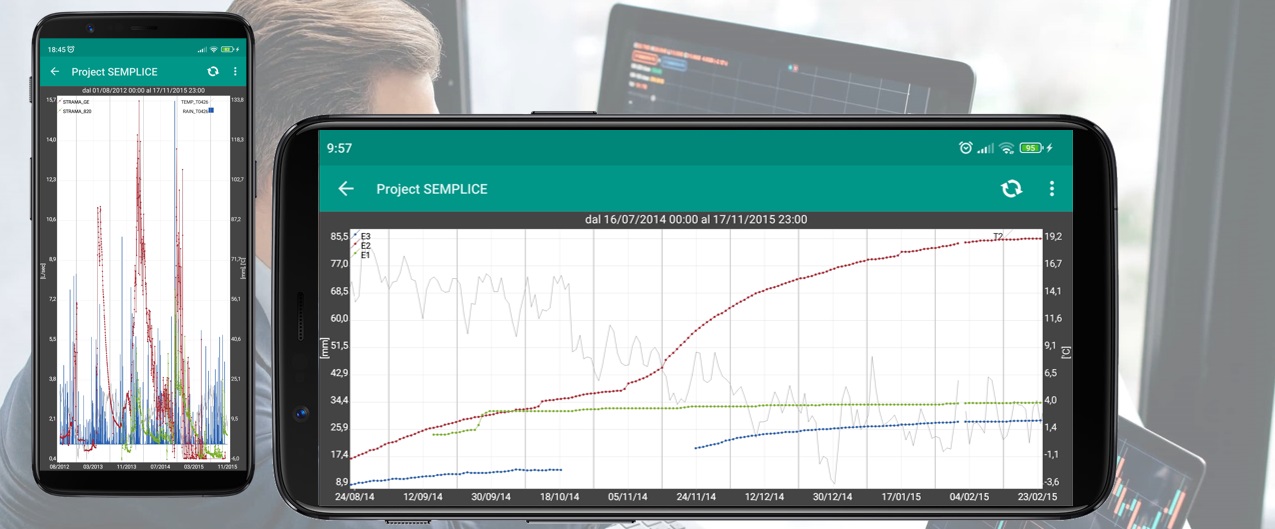
The SEMPLICE App offers high-quality plots at a professional level. It supports various chart types, multiple time-series, Y2 axis, custom styling, and real-time navigation features such as pan, zoom, and goto. Unlike relying on HTML5 charts, SEMPLICE incorporates native plotting capabilities
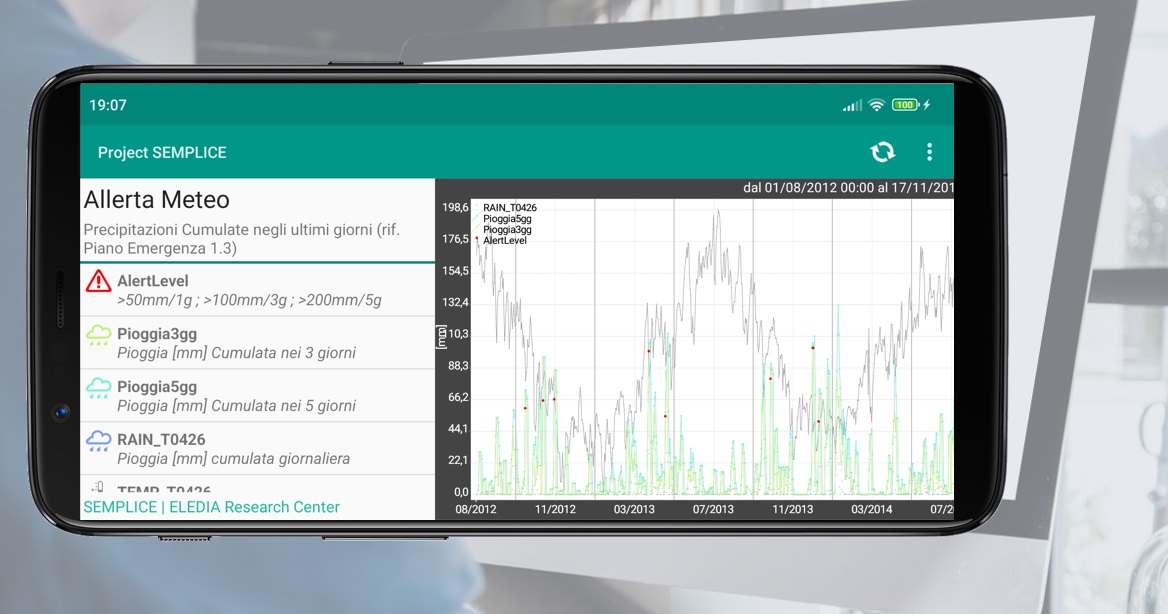
Evaluation & notification
Embed KPI in charts
SEMPLICE offers pre-built analytics for acquired data. User-defined Key Performance Indicators (KPIs) and a risk index are utilized to trigger alerts. Additionally, they can be plotted alongside related data
SEMPLICE incorporates powerful alerting features to ensure timely and informed decision-making. User-defined Key Performance Indicators (KPIs) and a risk index are utilized to trigger alerts, allowing for customizable monitoring based on specific metrics and thresholds. The embedded analytics capabilities enable the seamless integration of alerts with related data, providing a comprehensive view of the situation
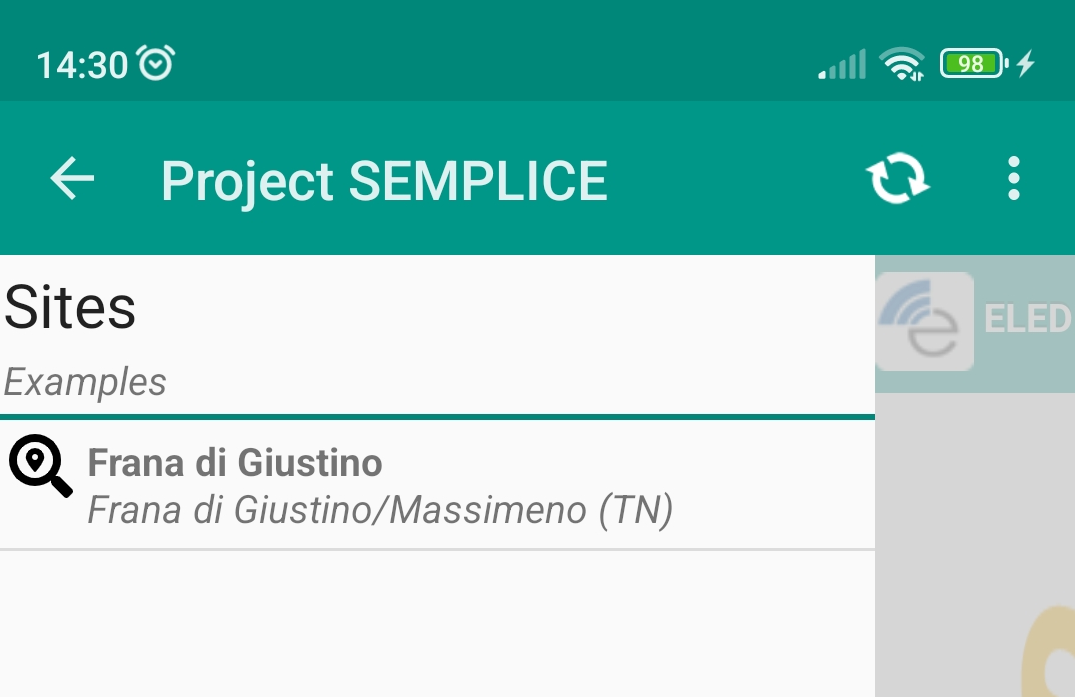
Add Sites and their Data/Charts to the system
Sites